YTSEOHub Guides · Updated July 2026
Reading YouTube Studio: CTR, Retention, and Watch Time
Stop staring at green and red arrows — learn what CTR, retention, and watch time actually tell you, and which lever to pull next.
By HAPPYMYNDS · ~12 min read · Practical YouTube SEO
YouTube Studio gives you more numbers than most creators know what to do with. Impressions, click-through rate, average view duration, average percentage viewed, watch time, real-time views — the dashboard can feel like a stock ticker for your self-esteem.
The fix is not learning every metric. The fix is learning the three that explain most performance swings on long-form videos: CTR (did people choose your video?), retention (did they stay once they clicked?), and watch time (how much total viewing did you earn?). Everything else is context.
This guide walks through how to read each metric without inventing fake benchmarks, how they interact, and what to change when one is strong and another is weak.
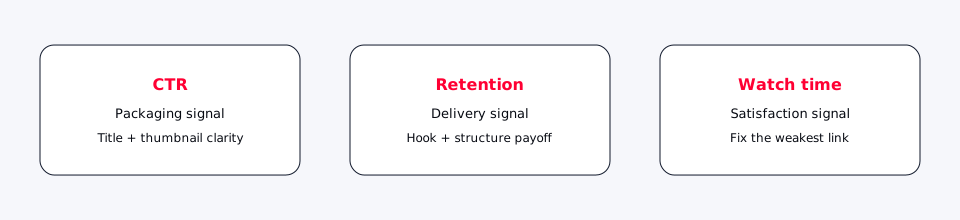
The three-metric framework
Think of a video's lifecycle in three stages:
- Discovery — YouTube shows your thumbnail and title (impressions).
- Selection — A viewer clicks (CTR).
- Consumption — The viewer watches and either stays or leaves (retention → watch time).
A video that fails at selection never gets a fair retention test. A video with great CTR but weak retention burns trust with the algorithm and with viewers who feel misled by the packaging. A video with solid retention but low CTR may be excellent content trapped behind weak packaging or shown to the wrong audience.
Your job when reading Studio is to identify which stage broke first — not to panic about a single number in isolation.
CTR: what it measures and what it does not
Click-through rate is clicks divided by impressions. In YouTube Studio, you will usually see it on the Reach tab for a single video, and in aggregate on the channel Analytics overview.
When CTR is meaningful
CTR becomes useful after you have enough impressions to stabilize the ratio. On a brand-new upload with 200 impressions, CTR can swing wildly from hour to hour. On a video with tens of thousands of impressions, the CTR you see is a reasonable picture of how compelling your title-and-thumbnail combo was to the audience YouTube chose to show it to.
That last phrase matters. CTR is not a universal score. A browse-feature thumbnail competing against entertainment thumbnails faces a different click environment than a search-result thumbnail shown to someone who typed a specific query. Comparing CTR across traffic sources is more informative than comparing CTR across unrelated videos.
How to read CTR by traffic source
- Browse / Suggested: Packaging competition is brutal. Low CTR here often means your thumbnail does not communicate a clear payoff in under one second, or your title does not match what viewers expect from channels like yours.
- YouTube search: CTR is tied to intent match. If someone searches "how to fix blurry exports in DaVinci Resolve" and your title says "My editing workflow," they may not click even if the video answers the question.
- External / Direct: CTR is often artificially high or not shown the same way because the viewer already decided to watch before the impression counted.
Use the CTR Benchmark tool to sanity-check your numbers against typical ranges for your content type — not as a grade, but as a prompt for whether packaging is the bottleneck.
What to change when CTR is low
If impressions are healthy but CTR lags on browse and suggested traffic, change packaging before you re-edit the video:
- Test a thumbnail with one focal subject and fewer words.
- Rewrite the title so the outcome is explicit in the first 40 characters.
- Check mobile legibility — most impressions are on phones.
- Align title promise with the first 30 seconds of the video so early retention does not collapse after the click.
Do not change CTR and retention on the same day and then wonder which fix worked. Change packaging, wait for meaningful new impression volume, then evaluate.
Retention: the shape of your video
Audience retention is the percentage of viewers still watching at each moment. YouTube shows it as a curve, not a single number. The curve is the diagnostic tool; average percentage viewed is the summary.
The first 30 seconds
Most videos lose viewers early. That is normal. What matters is whether the drop is a gentle slope or a cliff. A cliff usually means one of these happened:
- The opening repeated the title verbatim without adding new information.
- A long branded intro delayed the payoff.
- The video answered the title question immediately with nowhere left to go.
- Packaging promised something the opening did not deliver.
Example: a budgeting channel published "I tracked every expense for 90 days — here's what shocked me." The first 45 seconds were channel updates and sponsor mention. Retention dropped before the actual experiment appeared. Moving the first shocking finding to second 8 flattened the early cliff without changing the rest of the edit.
Mid-video dips and spikes
Dips often align with section transitions, jargon-heavy explanations, or on-screen pauses. Spikes frequently appear when you rewind the timeline — viewers replay a step. If you see a replay spike on a tutorial step, that step deserves a clearer on-screen label or a dedicated chapter title.
The Retention Calculator helps translate average percentage viewed into estimated average view duration when you are planning structure, especially for videos where a small retention gain materially increases watch time.
End retention and session behavior
Strong end retention suggests viewers finished and may continue to your end screen elements. Weak end retention means they left before your CTAs — fix the content pacing before you obsess over end-screen click rates. Cards and end screens only work if people are still watching.
What to change when retention is weak
- Re-open the video: first 30–60 seconds get the highest leverage edit.
- Add pattern breaks every 60–90 seconds in talking-head content (b-roll, zoom, graphic, perspective shift).
- Cut tangents that do not serve the title promise.
- Add chapters so viewers who already understand a section can skip without abandoning.
- For list videos, put the strongest item first, not last — many viewers never arrive at item seven.
Watch time: the product CTR and retention build together
Watch time is total minutes watched. YouTube uses it heavily because it represents satisfied viewing at scale. Two videos can have identical retention curves but very different watch time if one is eight minutes and the other is twenty-two minutes.
Average view duration vs average percentage viewed
Average percentage viewed tells you how much of the runtime people consumed. Average view duration tells you the absolute minutes. A 6-minute video at 55% average viewed equals roughly 3.3 minutes average view duration. A 18-minute video at 40% equals roughly 7.2 minutes — more watch time per view despite lower percentage.
This is why "make shorter videos for retention" is incomplete advice. Shorter videos can improve percentage while reducing total watch time per view. The right length is the shortest video that fully delivers the promise — not the shortest video possible.
Model scenarios with the Watch Time Calculator before you cut a 20-minute deep dive into a 9-minute summary that might win percentage but lose minutes.
Channel-level watch time vs video-level
At the channel level, watch time aggregates across uploads. One viral video can mask a retention problem on your typical uploads. When reviewing Analytics → Content → your baseline catalog, sort by watch time and inspect whether success is concentrated in one outlier or spread across a format you can repeat.
What to change when watch time is weak
Diagnose whether the problem is selection or consumption:
- Low views + low watch time: Often discovery and CTR. Packaging and topic demand come first.
- Healthy views + low watch time: Retention and structure. Tighten openings, improve pacing, match length to depth.
- Strong watch time on long videos but slow growth: You may be serving a loyal niche well without search-friendly packaging. Pair depth with clearer titles.
How the three metrics interact: four common patterns
Pattern A: High CTR, low retention
Packaging outran the content, or the opening failed to pay off the click. Viewers feel baited. Fix the first minute and align title claims with delivery. Consider whether the thumbnail promises something the video only addresses at minute nine.
Pattern B: Low CTR, strong retention
The video rewards viewers who find it, but not enough people click. Prioritize thumbnail contrast, title clarity, and search intent alignment. Retention is an asset — do not rewrite a well-retained video; sell it better.
Pattern C: Low CTR, low retention
Either the topic has weak demand for your audience, or the video misses on both packaging and structure. Check whether impressions are being shown to relevant viewers. If traffic sources are mostly suggested but the topic is highly specific, search optimization may help.
Pattern D: High CTR, high retention, flat growth
Less common but frustrating. Impressions may be capped because YouTube has not yet confidence-tested the video at scale, or the topic's audience size is naturally limited. Improve session continuation (playlists, sequels, end screens) and publish related follow-ups to build a cluster.
Engagement signals: comments, likes, and subs — supporting cast, not leads
Likes, comments, and subscribes correlate with satisfaction but do not replace retention. A controversial video can earn comments while retention tanks. Use engagement as a secondary check:
- High retention + low likes may mean viewers consumed passively (common in utility tutorials).
- High comments + mid retention may mean a polarizing moment drove discussion without holding everyone.
The Engagement Calculator helps you compare engagement ratios across your own uploads so you spot outliers — not to chase likes, but to see whether a video sparked action you can design for intentionally (clear question prompts, pinned comments with a specific ask).
Revenue context without fantasy RPM math
Watch time influences monetization eligibility and ad inventory, but revenue per video depends on CPM, viewer geography, seasonality, and ad format mix. Studio's Revenue tab lags and aggregates — useful for direction, not for per-hour creator accounting.
Use the Revenue Estimator to model scenarios with conservative RPM assumptions when deciding whether a watch-time-heavy format is worth the edit cost. The goal is range thinking, not false precision.
A practical weekly review ritual
Instead of checking Studio hourly on upload day, run this 20-minute weekly review:
- Last 28 days, top 3 videos by watch time: Note CTR source mix and retention shape. What format repeats?
- Last 28 days, bottom 3 videos with meaningful impressions: Identify whether CTR or retention failed first.
- One video to repackage: Strong retention, CTR below your channel median on browse traffic.
- One video to re-open: CTR fine, early retention cliff.
- One hypothesis for next upload: Single change only — new thumbnail style, shorter hook, chapterized structure, etc.
Log hypotheses in a simple doc. YouTube feedback loops are slow; memory is worse.
Mistakes that waste your time
- Judging CTR on day one with under 1,000 impressions.
- Comparing CTR across unrelated formats (Shorts vs long-form, search vs browse).
- Re-editing the entire video when only the first 45 seconds collapsed.
- Changing title and thumbnail repeatedly in 48 hours, muddying the data.
- Chasing average percentage viewed by chopping useful depth viewers wanted.
- Ignoring traffic sources and concluding "the algorithm hates me."
- Treating engagement rate as primary when retention clearly shows viewers leave at minute two.
Worked example: reading one video end to end
Suppose a home-studio creator published "Build a vocal booth for under $150 (landlord-friendly)." After two weeks: 48,000 impressions, CTR 3.1% on browse and 6.8% on YouTube search, average view duration 4:12 on a 9:40 video.
Step 1 — CTR: Search CTR is healthy; browse CTR is soft. Search titles are doing their job; suggested/browse packaging is not stopping the scroll. Action: test a thumbnail that shows the finished booth plus a clear "under $150" text block readable on mobile.
Step 2 — Retention: Curve shows a cliff at 0:35 during a backstory about apartment hunting; steadier slope after materials list begins. Action: move materials list to 0:20, trim backstory to one sentence.
Step 3 — Watch time: At 4:12 average view duration, the video earns meaningful minutes per view but leaves depth on the table. After hook fix, if percentage rises without shortening runtime, watch time per view climbs without sacrificing tutorial completeness.
Step 4 — Next upload: Apply the same diagnostic to the sequel ("sound test before and after") rather than guessing from channel-wide averages.
What to do next
Pick your last five uploads. For each, write one line: did CTR, retention, or distribution likely limit growth? Choose one video for a packaging test and one for an opening re-edit. Use the calculators linked in this guide to model watch time before you commit to a radical length change.
Metrics are not morale scores. They are lagging feedback on decisions you already made — thumbnails, titles, hooks, structure, and topic choice. Read them in that order, change one thing at a time, and let impressions tell you the truth.